Ryanair, a low-cost European airline and one of the largest in Europe. Project goal was to provide go-forward recommendations for Ryanair’s Twitter strategy based on a look-back analysis.
Analyze 16,000 tweets from January 2014 related to Ryanair.
Report on insights and provide recommendations for Ryanair’s Twitter strategy.
Tweets are from or mention @Ryanair or contain “ryanair”, #Ryanair, #ryanair.
Descriptive, content, peak, sentiment, and network analyses were conducted.
Ryanair tweet findings included:
Most active users
Top location of origin
Most frequent tweet day/time
Top word frequency
Spikes in tweet volumes
Sentiment distribution
Sub-community identification
Top community influencers
Recommendations for Ryanair include:
Adjust tweet timing to better align with peaks in conversation.
Expand on #Askryanair sessions based on positive sentiment.
Have a customer service representative respond to Twitter queries in real-time to manage negative sentiment tweets.
Google Big Query
SQL
R Studio
Gephi
Tableau
Microsoft Excel
Descriptive Analysis
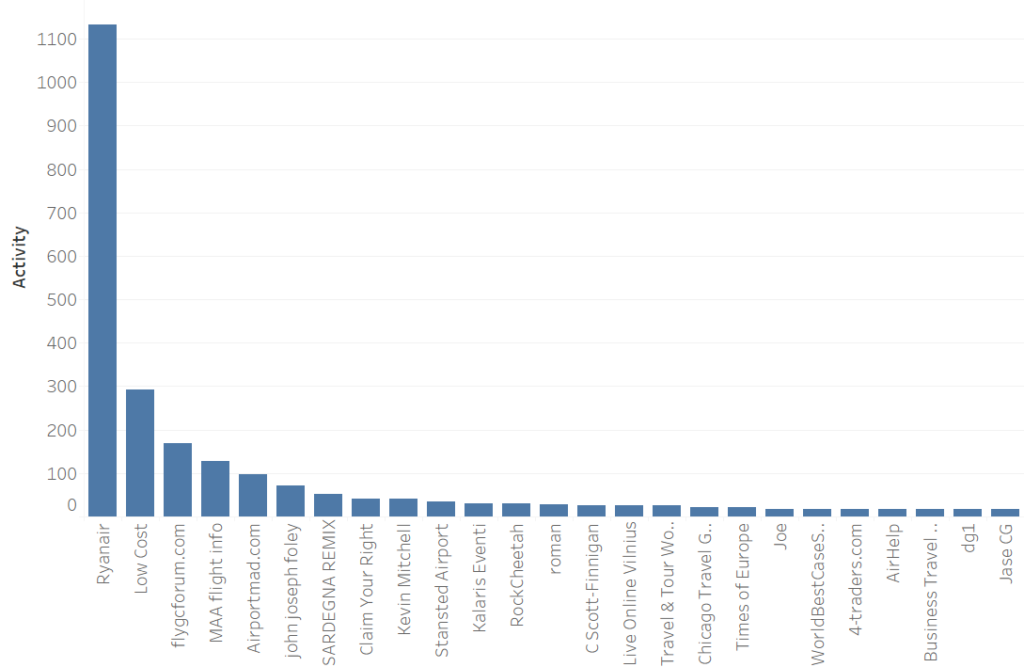
Figure 1: The 25 Most Active Users in the Twitter Data Set. Not surprisingly, the majority of tweets related to Ryanair are from the official @Ryanair Twitter account.
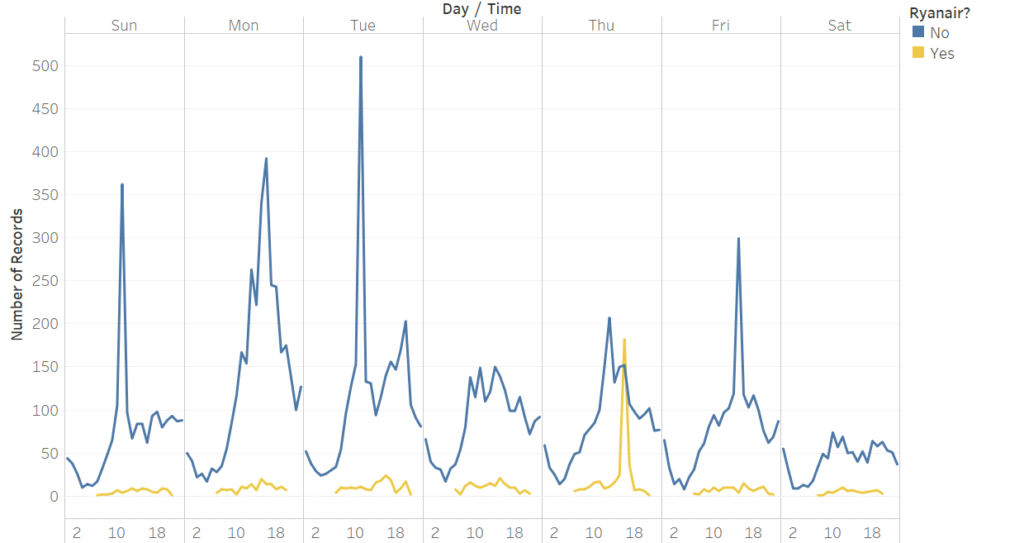
Figure 2: Tweeting Day/Time for Official @Ryanair vs. Other Twitter Accounts The most popular times that users (excluding @Ryanair) are tweeting about Ryanair include Tuesdays at 11a.m., Mondays at 4p.m., and Sundays at 11a.m. Ryanair should ensure it tweets at those times to better engage in the Twitter conversation about Ryanair.
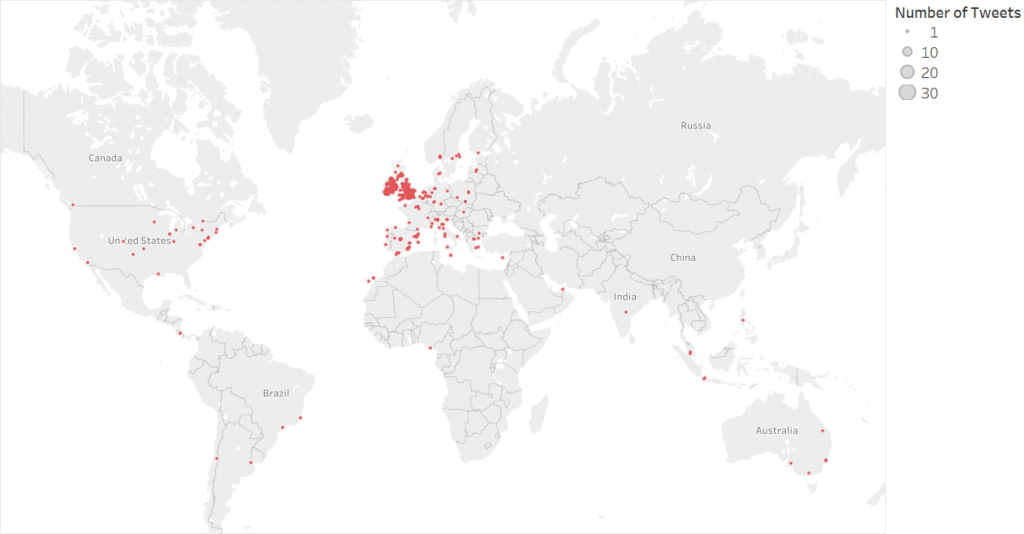
Figure 3: Geographical Visualization of Non-Ryanair Tweets The majority of non-Ryanair tweets were made from Europe, specifically Ireland and the United Kingdom. This is not surprising considering the majority of its routes operate in Europe, with its primary operational bases at Dublin and London Stansted airports.
Content Analysis
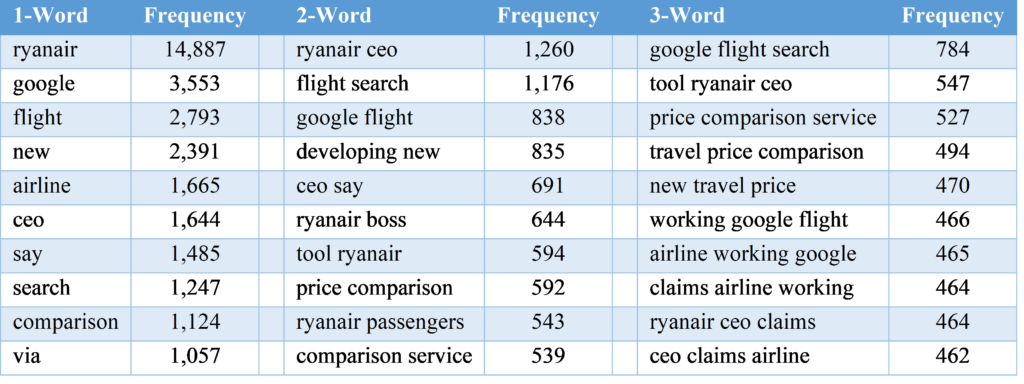
Figure 4: Frequency of One, Two, and Three-Word Combinations A frequent combination is related to Google. This is due to the fact that in January 2014, it was reported that Ryanair would begin to be listed on Google Flight Search, a price comparison tool.
Figure 5: Top 10 Hashtags #Askryanair is a weekly hour-long live chat and customer service event hosted by Ryanair on Twitter. The sessions occurred three times in January 2014. #Google and #seo hashtags are in relation to the previously mentioned Google Flight Search partnership.
Peak Analysis
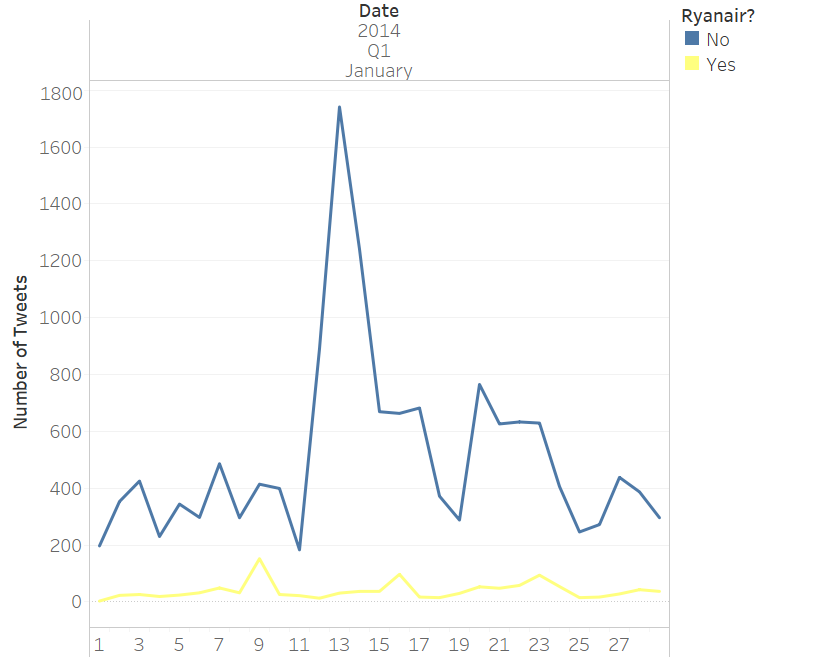
Figure 6: The Volume of Tweets over Time for Official @Ryanair vs. Other Twitter Accounts The most prominent peak occurred on January 13, 2014 when there were 1,741 tweets, a 851% jump from 183 tweets two days prior on January 11, 2014. This was a result of an Irish Independent interview with Ryanair’s CEO, Michael O’Leary, claiming that Ryanair is in partnership with Google to develop a new price comparison tool.
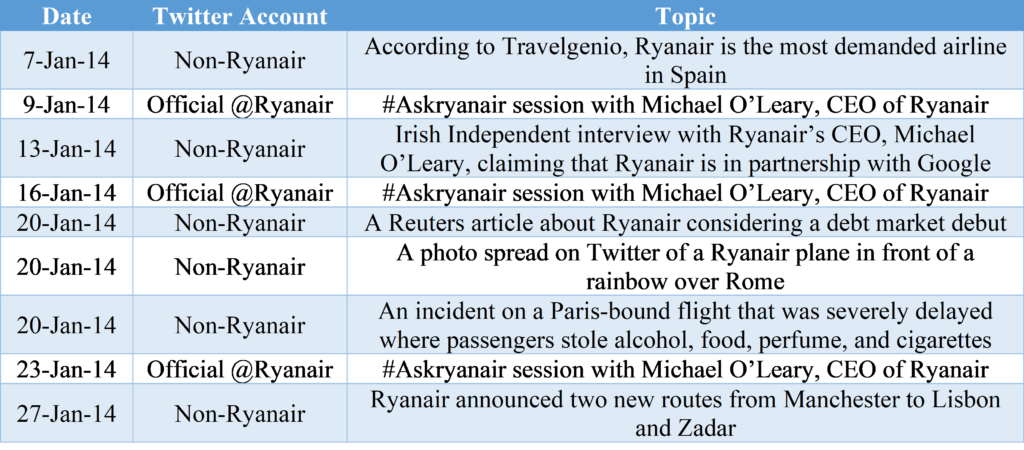
Figure 7: Peak Topics Identified All of the Official @Ryanair tweet spikes were in relation to #Askryanair sessions. Non-Ryanair tweet spikes were related to newspaper interviews, viral images, a flight incident, and the announcement of new routes.
Sentiment Analysis
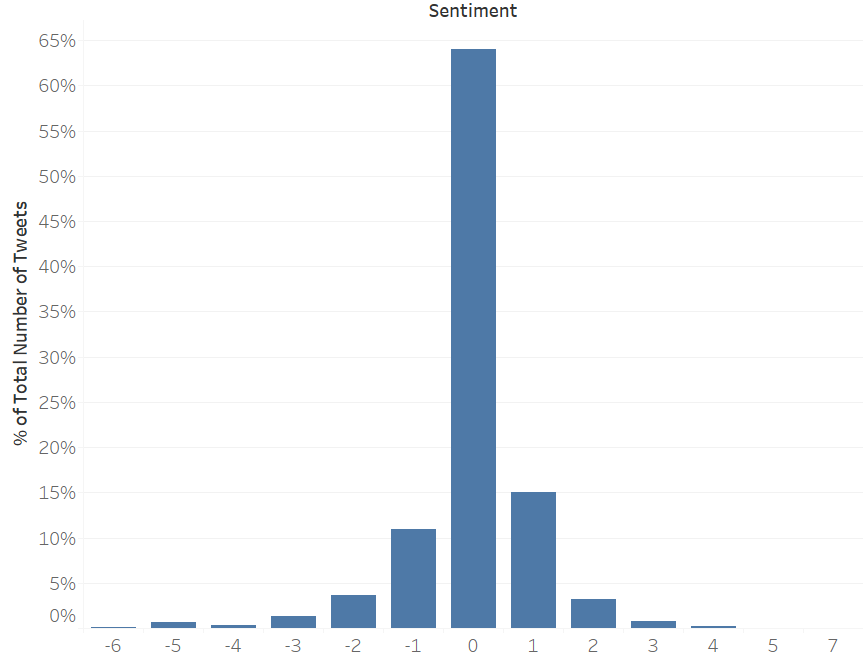
Figure 8: Sentiment Distribution All of the tweets from the data set were assigned a sentiment score ranging from -6 to +7, with -6 having the most negative sentiment, 0 having a neutral sentiment, and +7 having the most positive sentiment. 64% of the tweets had a neutral sentiment. 79% of the negative tweets scored ≤ -3 were related to a Paris-bound flight that was severely delayed. 8% of the positive tweets scored ≥ +3 were related to the #Askryanair sessions.
Note: This analysis was conducted using packages in R Studio which mapped the tweeted words against a list of positive and negative words. Then, the number of words mapped to “positive” were subtracted by the number of words mapped to “negative” and a net sentiment score was provided. However, these findings are limited as they do not consider the context of the entire string, such as a comparison between two different airlines, nor is it considering language usage such as sarcasm.
Network Analysis
Figure 9: Network Topology of the Four Largest Sub-Communities (SC1-4) The community analysis identified 1,766 communities within the tweet dataset, which reflects the spacial nature of the network. SC1 has 862 nodes and SC2 has 66 nodes. This means that 19% of the nodes in the entire network are a member of the largest or second largest communities. @Ryanair is the main hub in SC1 and @Ryanairdontcare is the main hub in SC2. The third largest community has 61 nodes (1% of the network) and represents a hub related to horseracing, regarding the Ryanair Chase. The fourth largest community has 21 nodes (0.42% of the network) and @Bitsboutplanes and @EasyJet are the main hubs.
Note: The network analysis used the Twitter user screenname and the reply to screenname attributes to establish connections in the social network. It was conducted using Gephi, an open-source visualization program. The ForceAtlas 2 algorithm was used to develop the network. The nodes in the network represented Twitter users and the edges represented Twitter replies.